ScienceThe good news
Perseverance breaks the distance record on another world
On 11 October, the rover reached 45.22 kilometres on Mars, passing Opportunity. The distance helps it explore more rocks, rather than win a race.
From the archive: the edition of , with the original dates and sources for every story. Read the latest edition.
Music for today ·On 11 October, the rover reached 45.22 kilometres on Mars, passing Opportunity. The distance helps it explore more rocks, rather than win a race.
The £19.8 million project has secured its permissions. The first rocks by sea are expected in the week after 14 October, weather permitting.
AI illustration · Positive Times · ImageGen
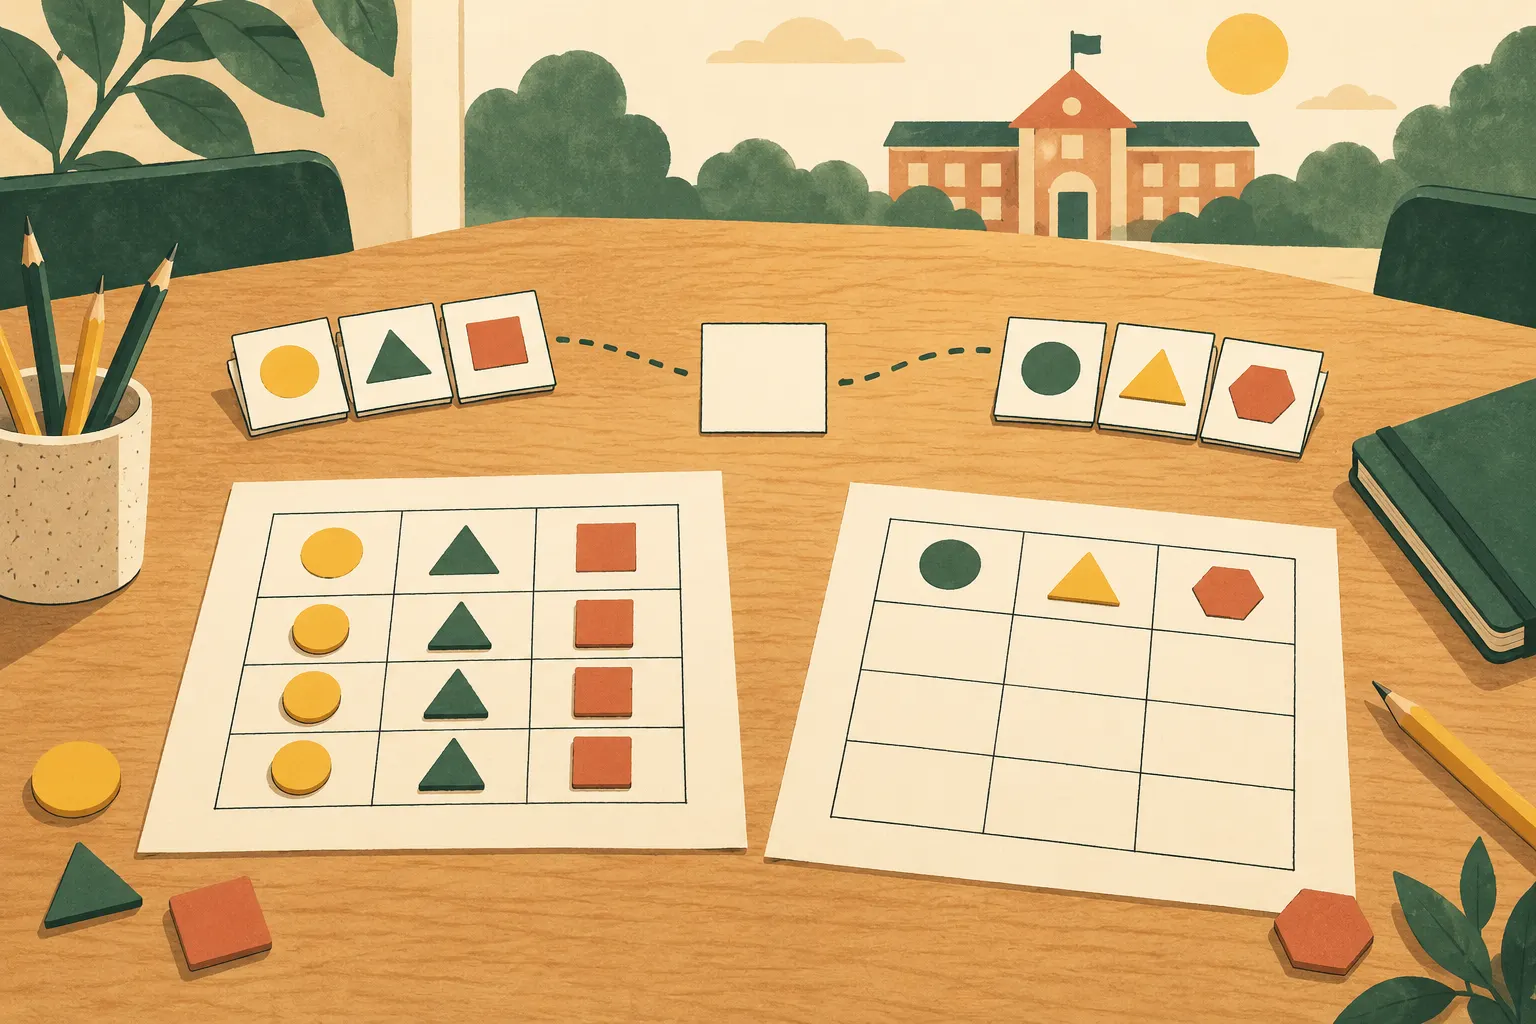
A workshop held in Kingston on 5–8 October prepares a shared statistical repository. The platform still needs to be developed and put into operation.
AI illustration · Positive Times · ImageGen
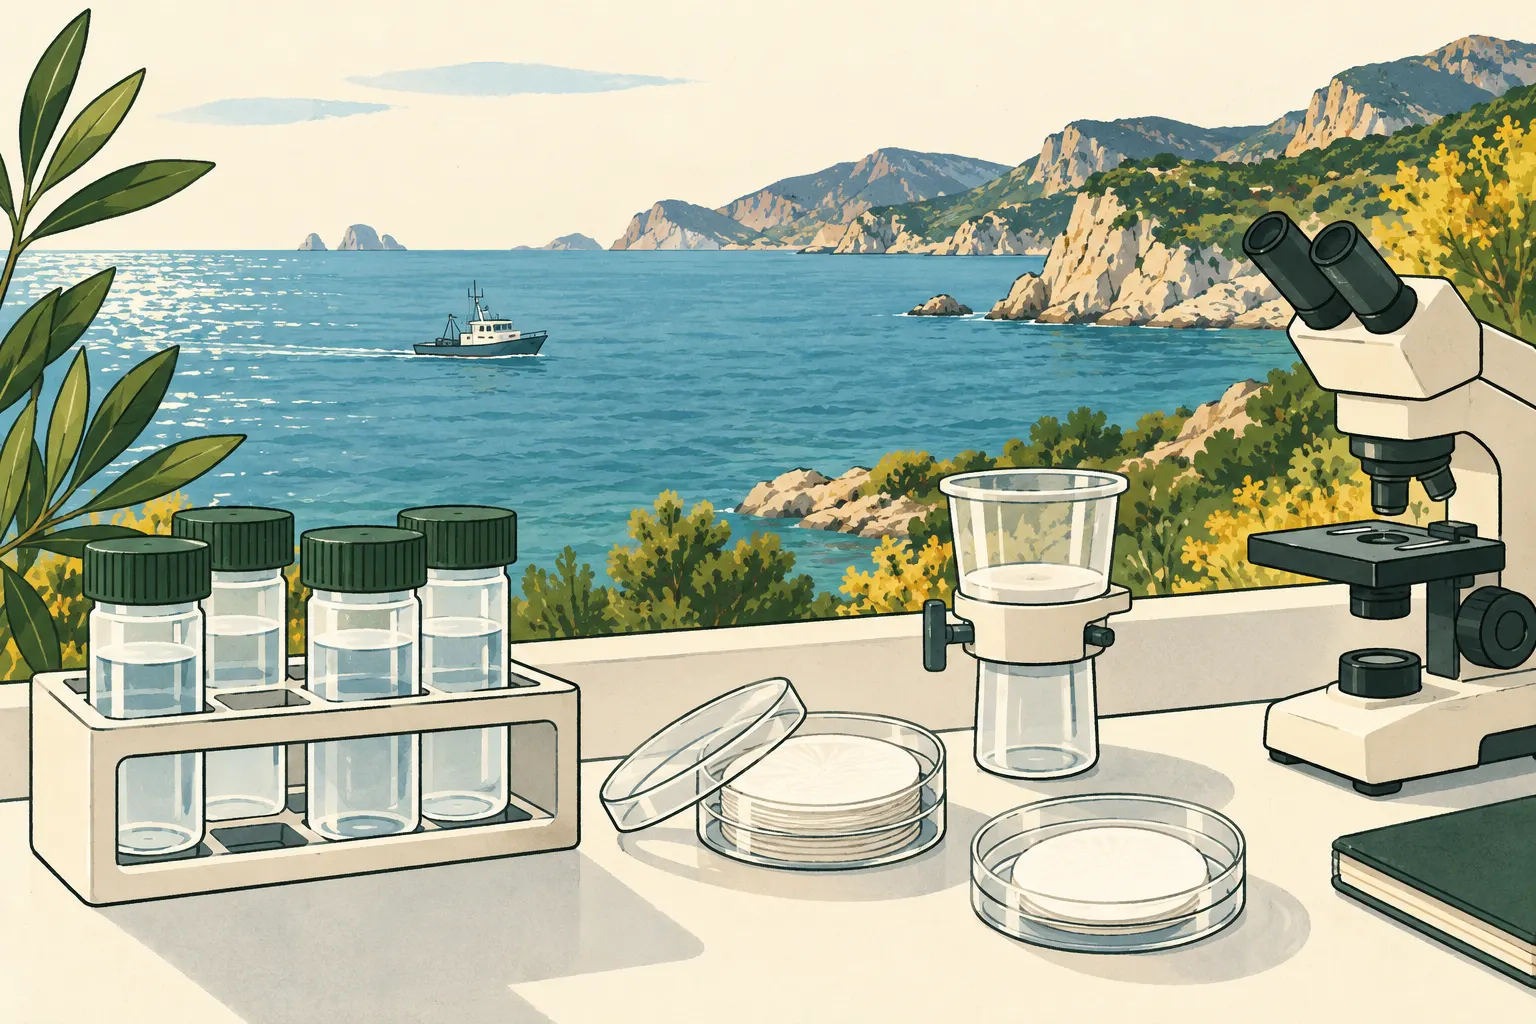
The expedition ended on 9 October with 108 filters for microplastic analysis and 14 environmental DNA samples. Laboratory results are still to come.
AI illustration · Positive Times · ImageGen
EOSC Italy and the CNR-led ocean node have been operational since 8 October. The federation now has 14 active nodes and more than 120 scientific services.
AI illustration · Positive Times · ImageGen
A free visit to the Umberto I Library is scheduled from 3 to 5.30 pm for Italy’s Historic Hospitals Day.
AI illustration · Positive Times · ImageGen
A workshop held in Botswana on 9 October prepares environmental criteria that countries can compare. The voluntary framework is still to be developed.
AI illustration · Positive Times · ImageGen
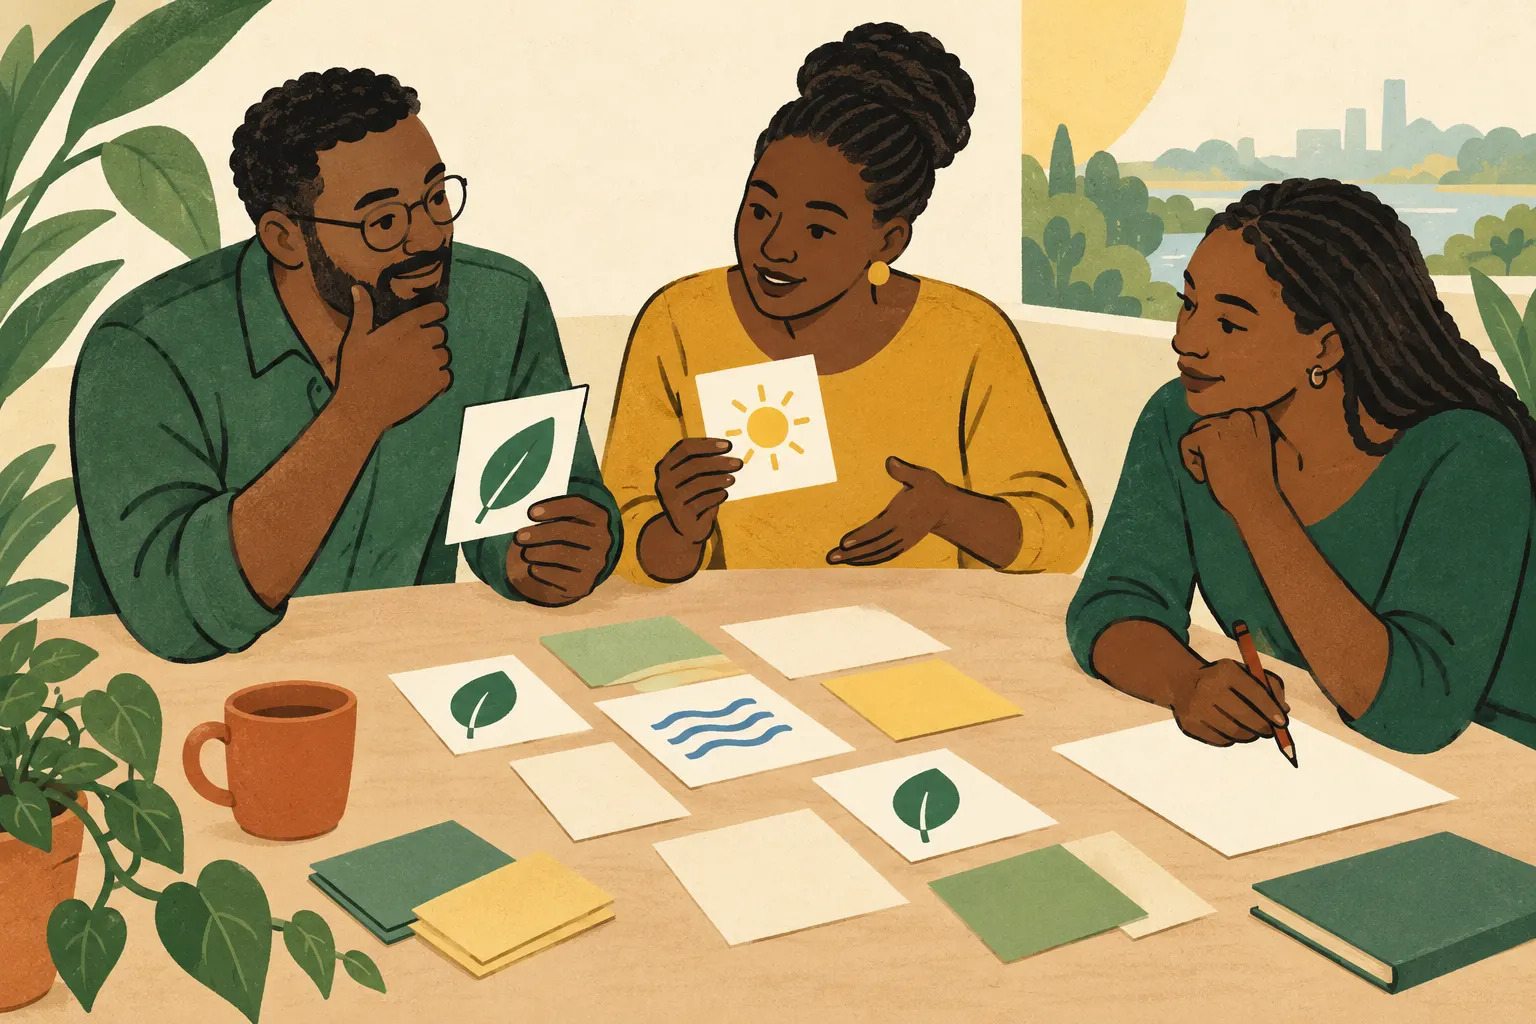
The fourth annual Global-Hub meeting on Indigenous Peoples’ food and knowledge systems opened on 12 October.
AI illustration · Positive Times · ImageGen
Design · Philosophy · Plants · Curiosities · Words · Food · Cultures & peoples · Curiosities. Ideas worth a closer look.

The rings of the Bölgeblick range give an everyday object a clear identity, while stacking brings the design into domestic routines.
Read the full story
In the first book of On the Nature of Things, water-worn stone becomes a clue for reasoning about invisible processes.
Read the full story
The prayer plant raises its leaves at night: a transformation to observe without automatically treating it as a sign of trouble.
Read the full story
Inside its mouth, a flexible ribbon called a radula works on food: its microscopic teeth look nothing like our own.
Read the full story
From a place for wrestling to exercises of the mind, the same Italian word connects a physical setting with experiences that test us.
Read the full story
Fresh pineapple can stop a dessert from setting: bromelain acts on proteins, and the ingredient’s processing history makes a difference.
Read the full story
Crossing and twisting threads wound on bobbins creates a textile while keeping knowledge moving between people and places.
Read the full story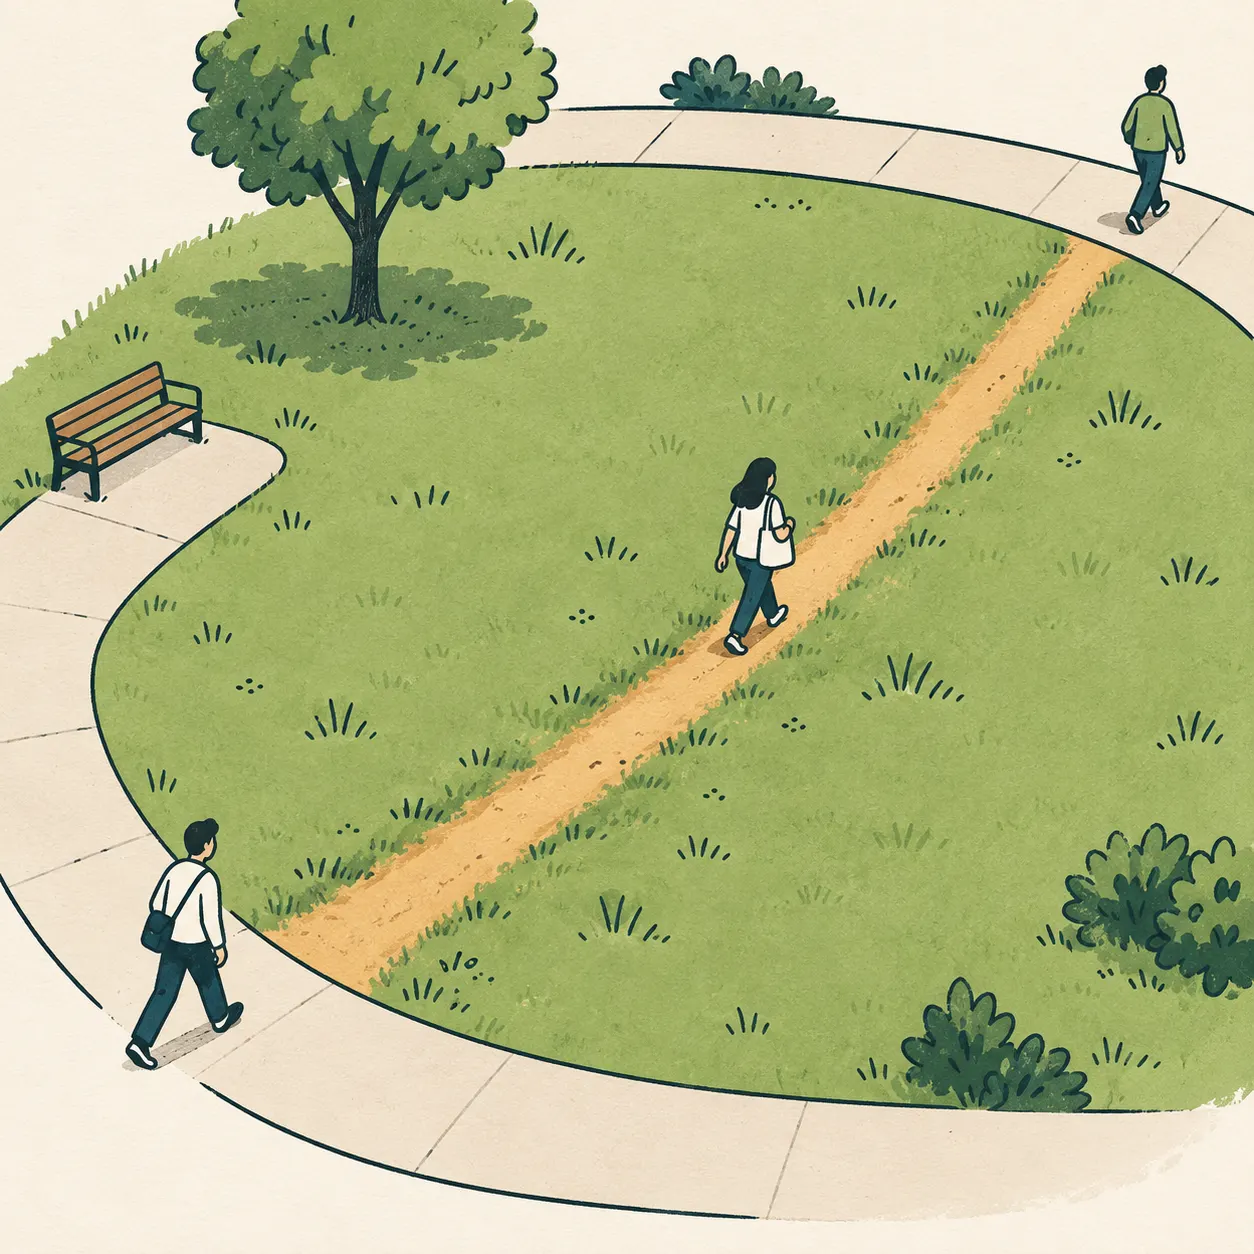
A trace in the grass raises a question about space: how can other people’s footsteps become clues for those arriving later?
Read the full storyOriginal illustrations made with AI assistance. Facts and sources stay in plain sight.
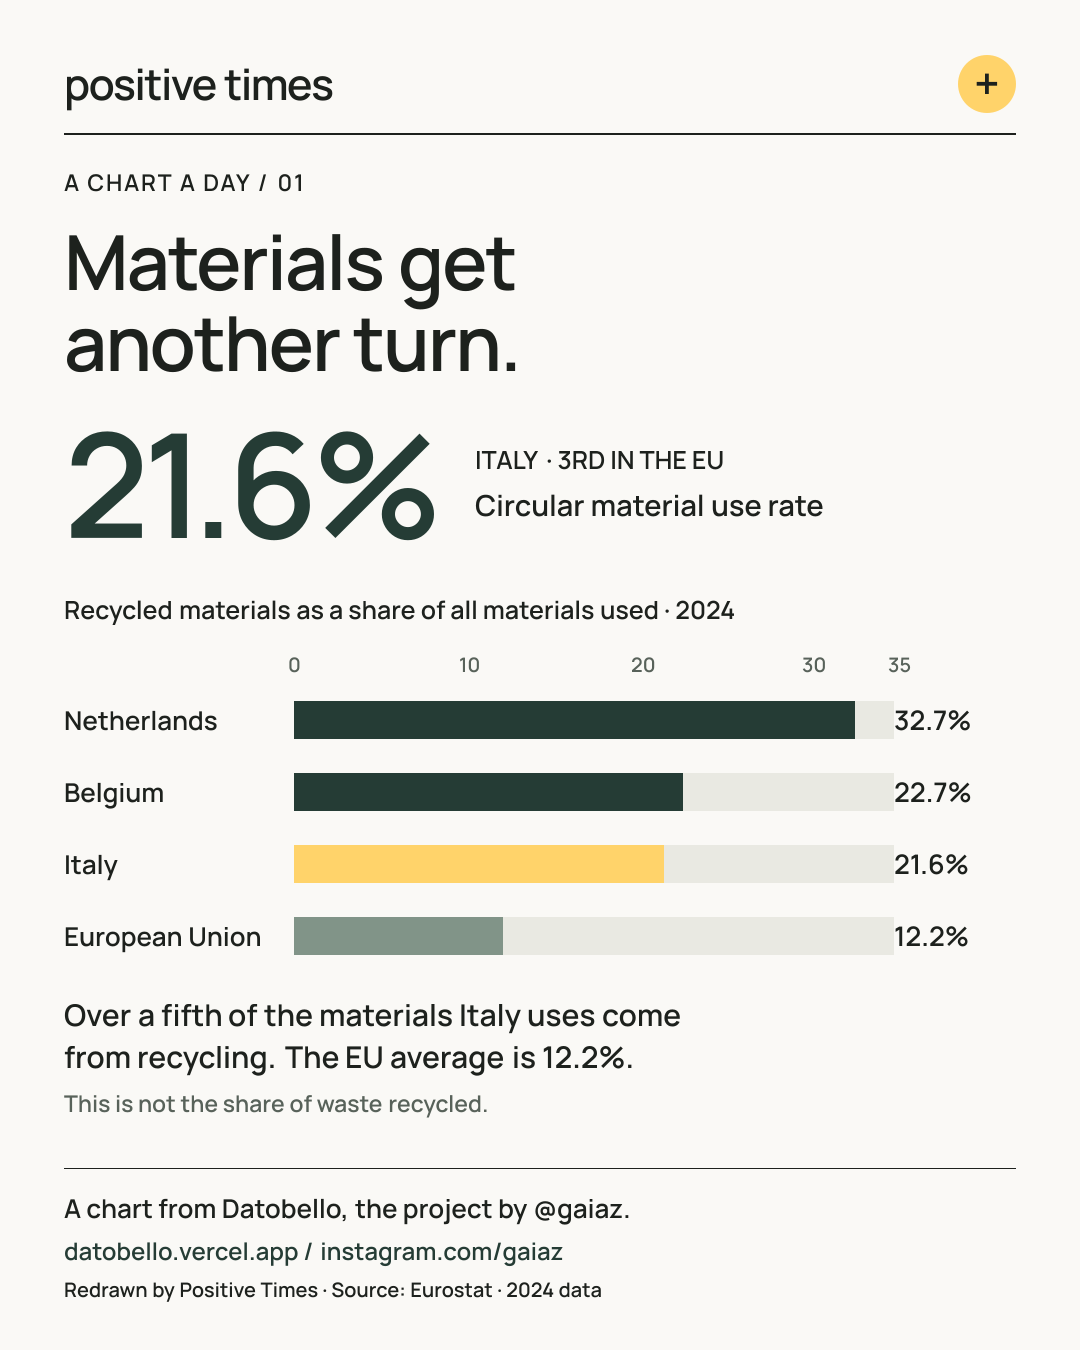 Enlarge the chart
Materials can have more than one life. In 2024, recycled materials accounted for 21.6% of Italy’s total material use: the third-highest rate in the European Union, behind the Netherlands and Belgium. The EU average was 12.2%. [1]
The chart tracks recovered materials returning to the economy, rather than the share of waste recycled. Recovering materials helps reduce the need to extract new ones. [2]
A project by gaiaz · Instagram
That is quite a lot of good for one day.
Browse the other editions